estimating camera measures#
You will likely run into cases where you cannot use the given fiducial markers and/or the calibration report in order to resample the images. This might be because:
the fiducial markers are obscured or otherwise cut off in the scans;
the fiducial markers are ambiguous;
the calibration report has been lost to time, or you otherwise do not have a calibration report.
In these cases, you can use a combination of spymicmac.matching, spymicmac.micmac.batch_saisie_fids()
and spymicmac.micmac.estimate_measures_camera() to generate a MeasuresCamera.xml file with the fiducial
marker locations.
identifying fiducial markers#
Important
When you are inputting fiducial marker locations using spymicmac.micmac.batch_saisie_fids(),
make sure your image orientation is consistent!
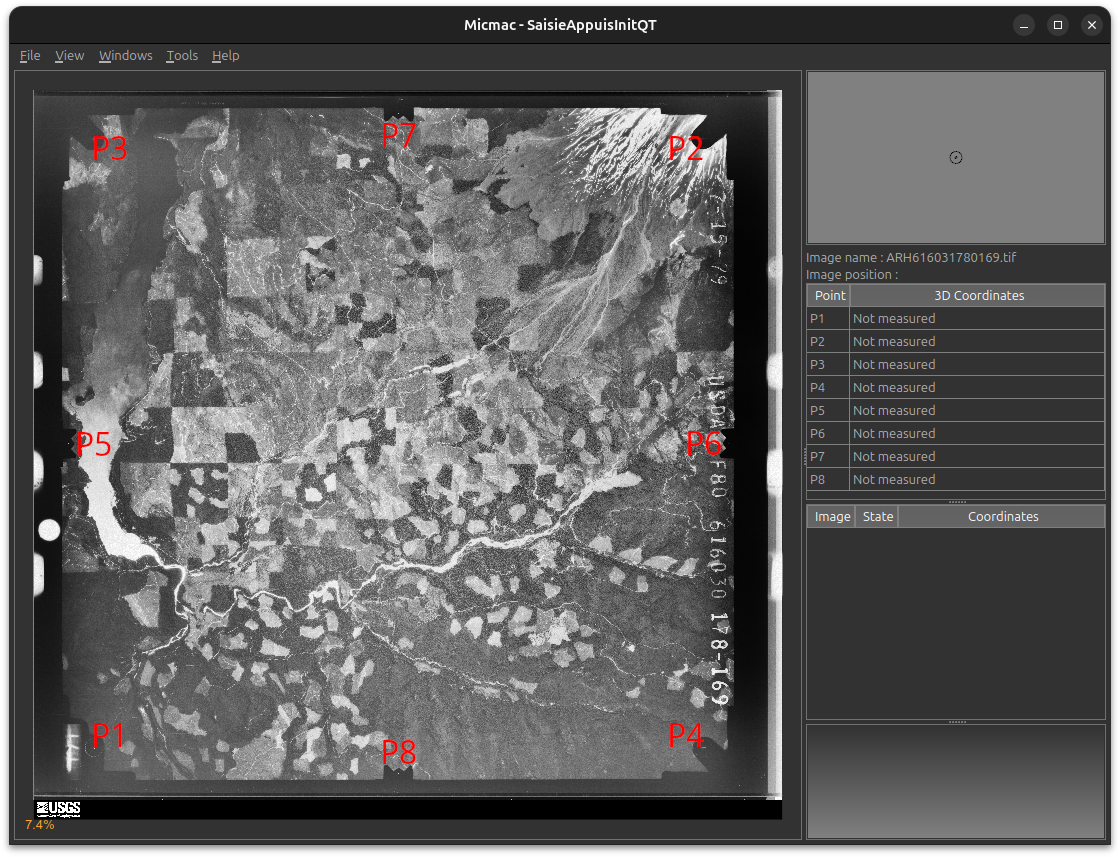
Scans will sometimes have the images rotated, but not consistently. For example, this image, which has the data strip on the right side, whereas most of the others have the data strip on the left:
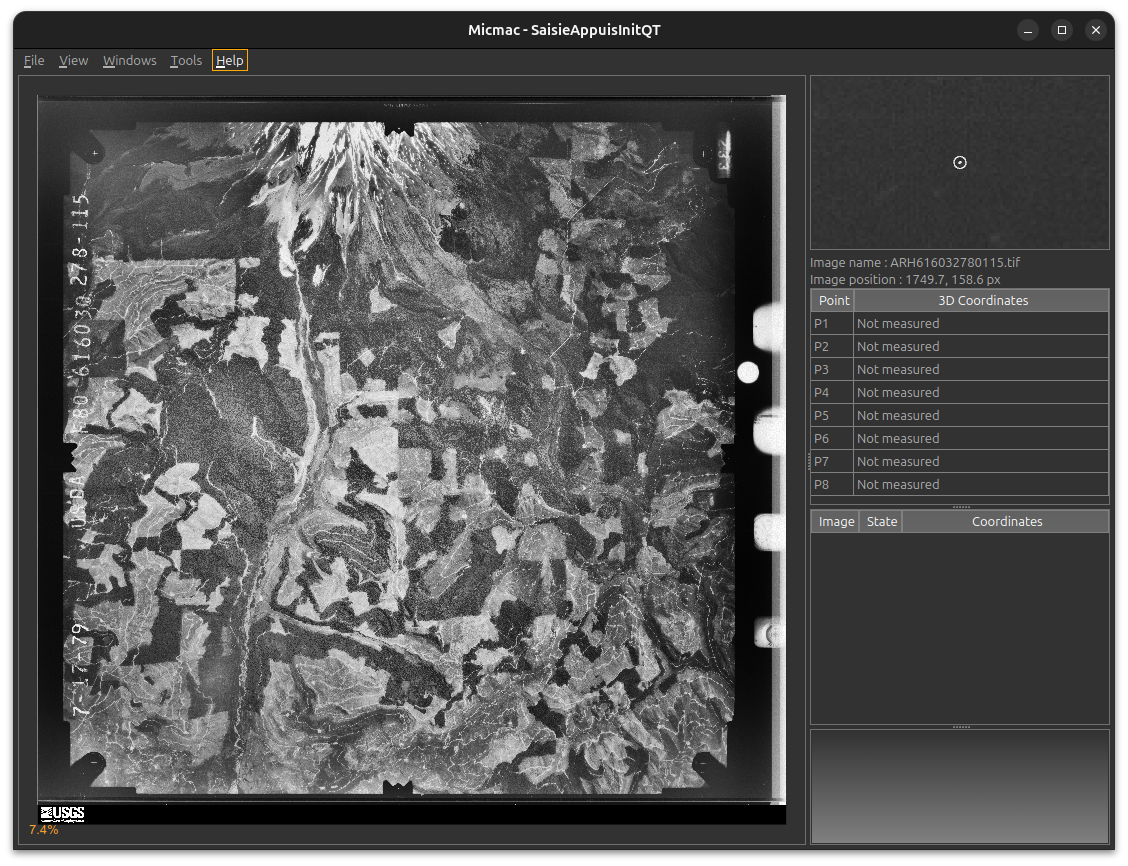
Most calibration reports will give the fiducial marker locations with the assumption that the data strip is on the left-hand side of the image, but be sure to check!
Create MeasuresIm files for a number of images - you don’t necessarily need to use all of the images that you have
(but at the same time, you’ll need to do this step anyway), but you should come up with a sufficient sample size to
be able to smooth over any differences due to difficulty identifying marks, or issues with film development or scanning.
worked example#
To illustrate how this works, we’re going to use an example for a set of images that does have a calibration certificate:
The calibration certificate for these images can be downloaded from the
USGS Camera Calibration Reports Database - this is Report
Number RT-R/403:
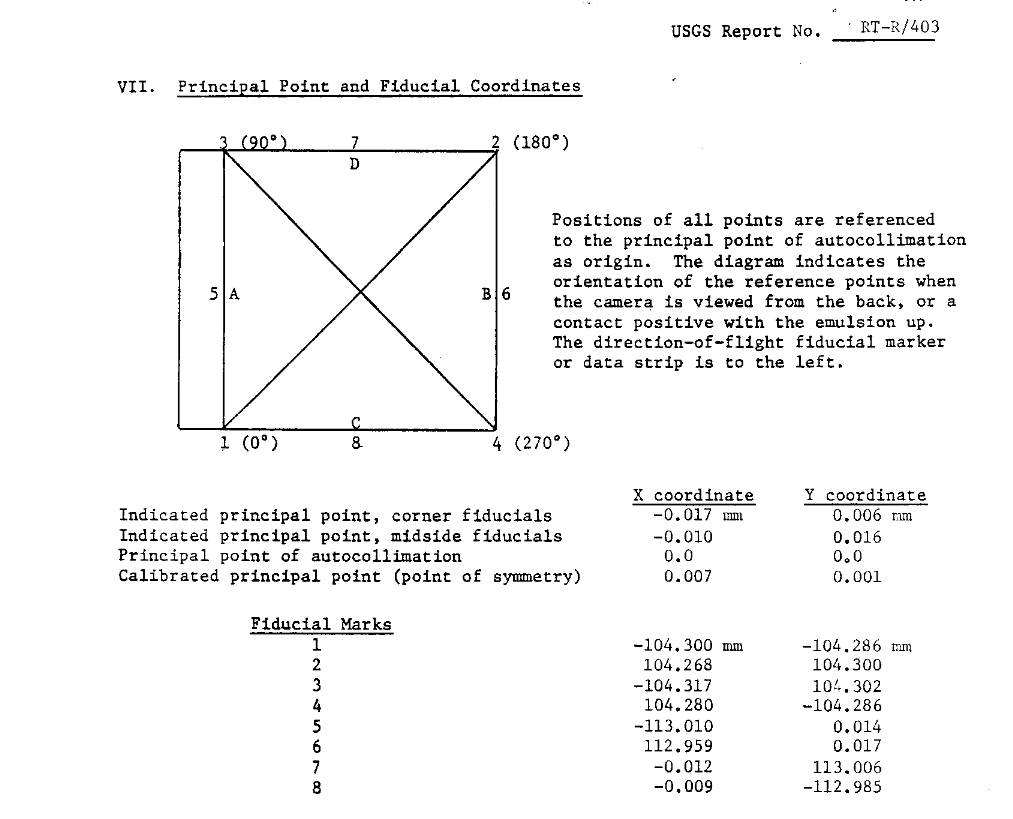
Translating the coordinates from the report using spymicmac.micmac.create_measures_xml(), we have the
following locations for our fiducial markers:
name |
x |
y |
|---|---|---|
P1 |
8.710 |
217.292 |
P2 |
217.278 |
8.706 |
P3 |
8.693 |
8.704 |
P4 |
217.290 |
217.292 |
P5 |
0.0 |
112.992 |
P6 |
225.969 |
112.989 |
P7 |
112.998 |
0.0 |
P8 |
113.001 |
225.991 |
To be able to use spymicmac.micmac.estimate_measures_camera(), we need the following information,
detailed/illustrated in the next sections:
approx: aDataFrameof approximate fiducial marker locations, or a dict of fiducial marker names and their angle with respect to the principal point;pairs: a list of pairs of co-linear fiducial markers;
We also need to know the scanning resolution of the image in meters, to be able to convert from pixels to camera
geometry - for example, if the images are scanned at 25 microns (25 µm per pixel), the value of scan_res should be
2.5e-5 (\(2.5 \times 10^{-5}\) m per pixel).
approximate measures#
The following code will create a DataFrame with the approximate fiducial marker locations for the
camera illustrated above:
Note
Note the convention here, with the y (i) axis starting with 0 at the top of the image, increasing to 1 at
the bottom of the image.
approx = pd.DataFrame(data={'name': ['P1', 'P2', 'P3', 'P4', 'P5', 'P6', 'P7', 'P8'],
                            'j': [0, 1, 0, 1, 0, 1, 0.5, 0.5],
                            'i': [1, 0, 0, 1, 0.5, 0.5, 0, 1]}).set_index('name')
name |
x |
y |
|---|---|---|
P1 |
0 |
1 |
P2 |
1 |
0 |
P3 |
0 |
0 |
P4 |
1 |
1 |
P5 |
0 |
0.5 |
P6 |
1 |
0.5 |
P7 |
0.5 |
0 |
P8 |
0.5 |
0 |
Note
These values don’t need to be exact - this is primarily used to align the locations measured for each image. Values of 0, 1 for corner fiducials and 0, 0.5, or 1 for mid-side fiducials should be sufficient.
Alternatively, we can pass a dict of name/value pairs with the fiducial marker names and the angle they make with
respect to the principal point and the x-axis.
Here, we’re imagining that the principal point is the origin of a coordinate axis, with the x-axis increasing toward the right, and the y-axis increasing towards the top of the image:
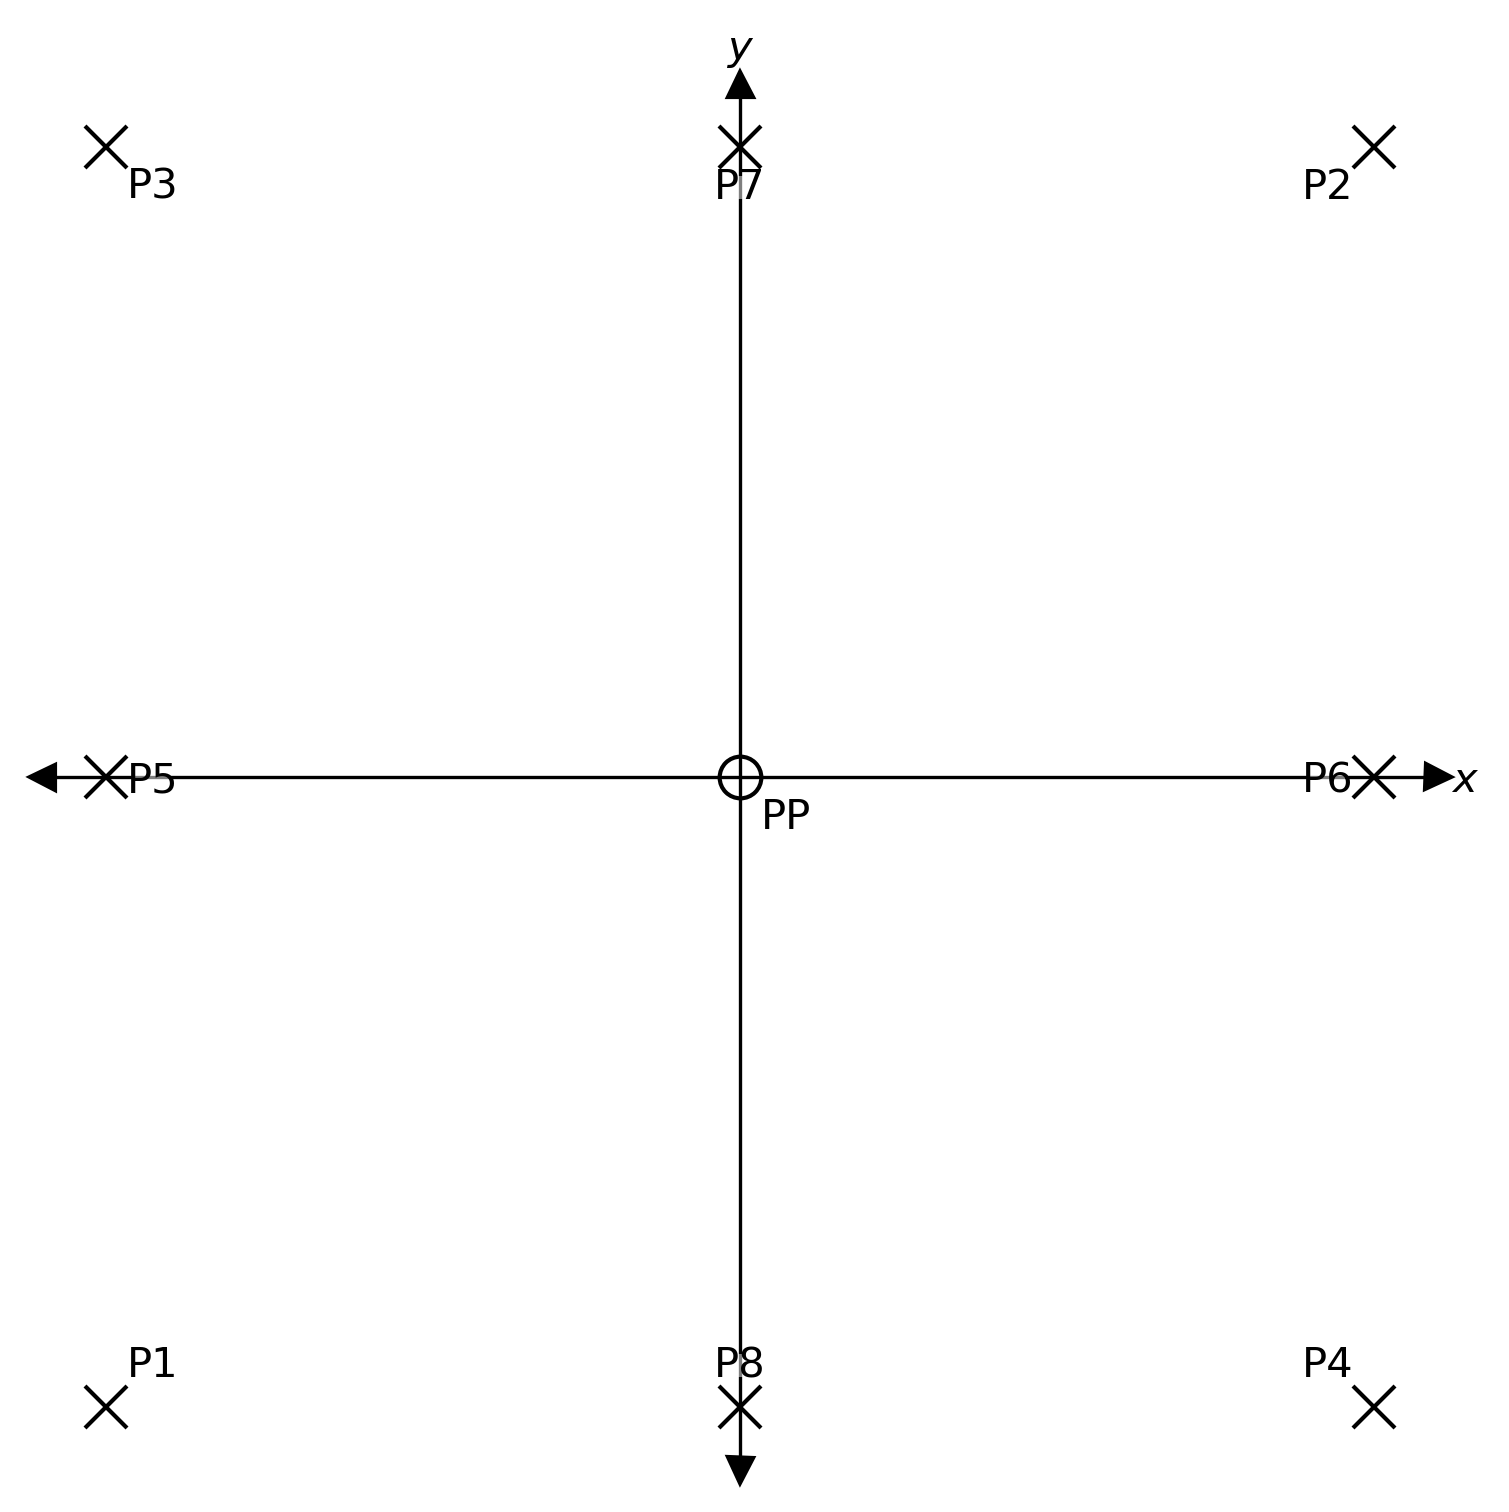
Using the examples above, P1 makes an angle of 225° (or \(5\pi / 4\)); P2 makes an angle of 45° (or \(\pi\)/4),
P3 makes an angle of 135° (or \(3\pi / 4\)), and so on:
angles = {'P1': 225, 'P2': 45, 'P3': 135, 'P4': 315,
          'P5': 180, 'P6': 0, 'P7': 90, 'P8': 270}
Note
Angle values can be either given in degrees or radians.
collinear pairs#
Finally, we need a list of the collinear pairs - that is, the pairs of fiducial markers that are co-linear with the principal point:
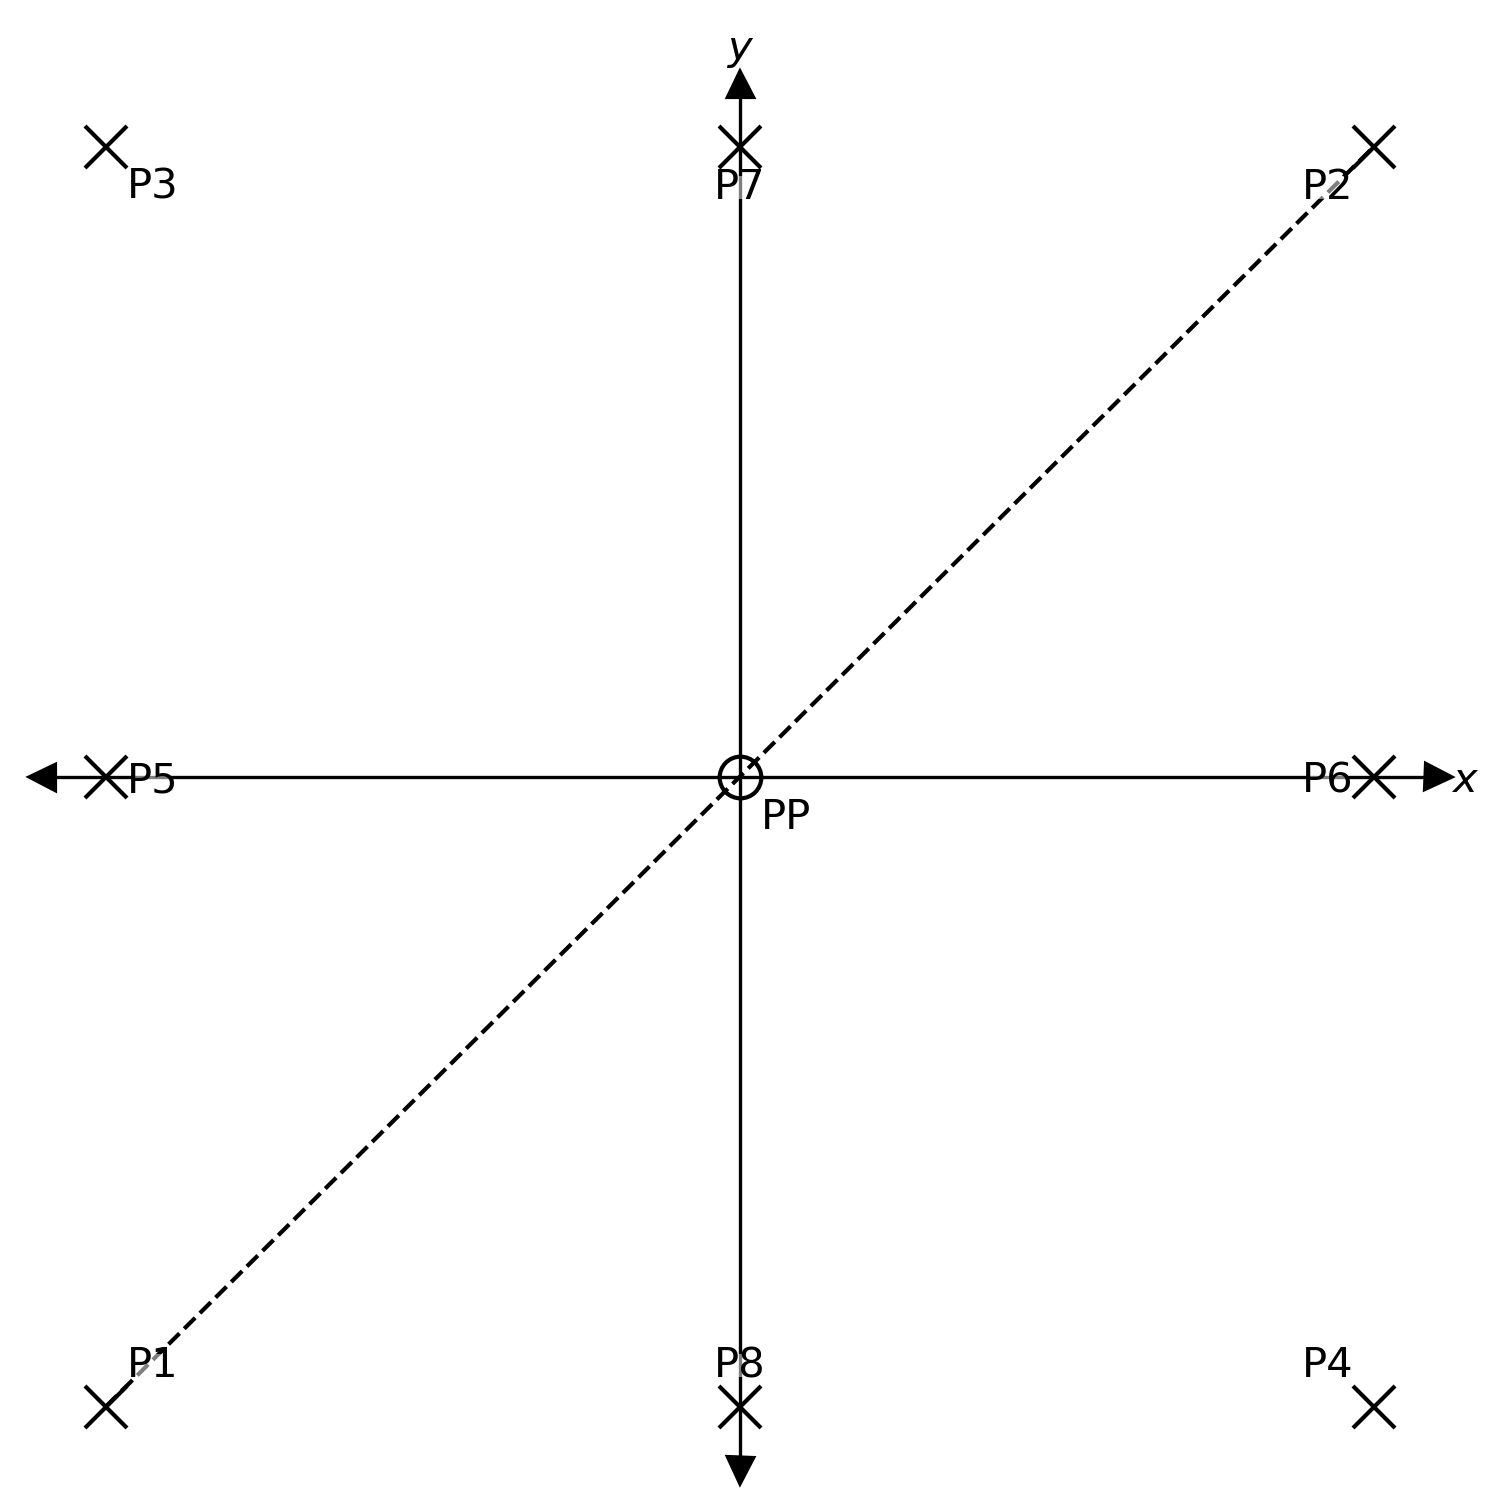
In the example above, P1 and P2 are collinear, as the line connecting them passes through the principal point.
A list of each of the pairs of collinear markers would then be:
pairs = [('P1', 'P2'), ('P3', 'P4'),
         ('P5', 'P6'), ('P7', 'P8')]
scanning resolution#
The last piece of information that we need is the scanning resolution, in m. If you happen to know this value (for example, you know that the images were scanned at 25 micron resolution), then you can use this directly.
However, it is worth noting that the nominal/reported value is not necessarily the true value, and it is perhaps worth calculating the distance between a pair of collinear markers (or several pairs). Using calibration reports for similar cameras, you can then estimate the scanning resolution by dividing the expected distance in mm by the measured distance in pixels.
checking the results#
With these pieces in place, we can run estimate_measures_camera.
This will read all of the MeasuresIm files in the given ori directory (e.g., InterneScan for
Ori-InterneScan), rotate the coordinates to match with the values given by approx, and scale them with the
value given by scan_res:
import pandas as pd
from spymicmac import micmac


approx = pd.DataFrame(data={'name': ['P1', 'P2', 'P3', 'P4', 'P5', 'P6', 'P7', 'P8'],
                            'j': [0, 1, 0, 1, 0, 1, 0.5, 0.5],
                            'i': [1, 0, 0, 1, 0.5, 0.5, 0, 1]}).set_index('name')

pairs = [('P1', 'P2'), ('P3', 'P4'),
         ('P5', 'P6'), ('P7', 'P8')]

micmac.estimate_measures_camera(
    approx,
    pairs,
    ori='InterneScan',
    scan_res=2.5e-5,
    how='mean', # choose between mean, median
    write_xml=True # if True, creates Ori-{ori}/MeasuresCamera.xml
    inverted=True # y-axis used for approx is inverted
)
This will create two .csv files in the current directory:
AverageMeasures.csv, containing the average location calculated from eachMeasuresImfile;AllMeasures.csv, containing the (rotated) locations for eachMeasuresImfile.
If write_xml is True, this will also create Ori-{ori}/MeasuresCamera.xml, which can be read by, for example,
mm3d ReSamFid.
To see how we’ve done, let’s compare the results from this set of images with the calibration report:
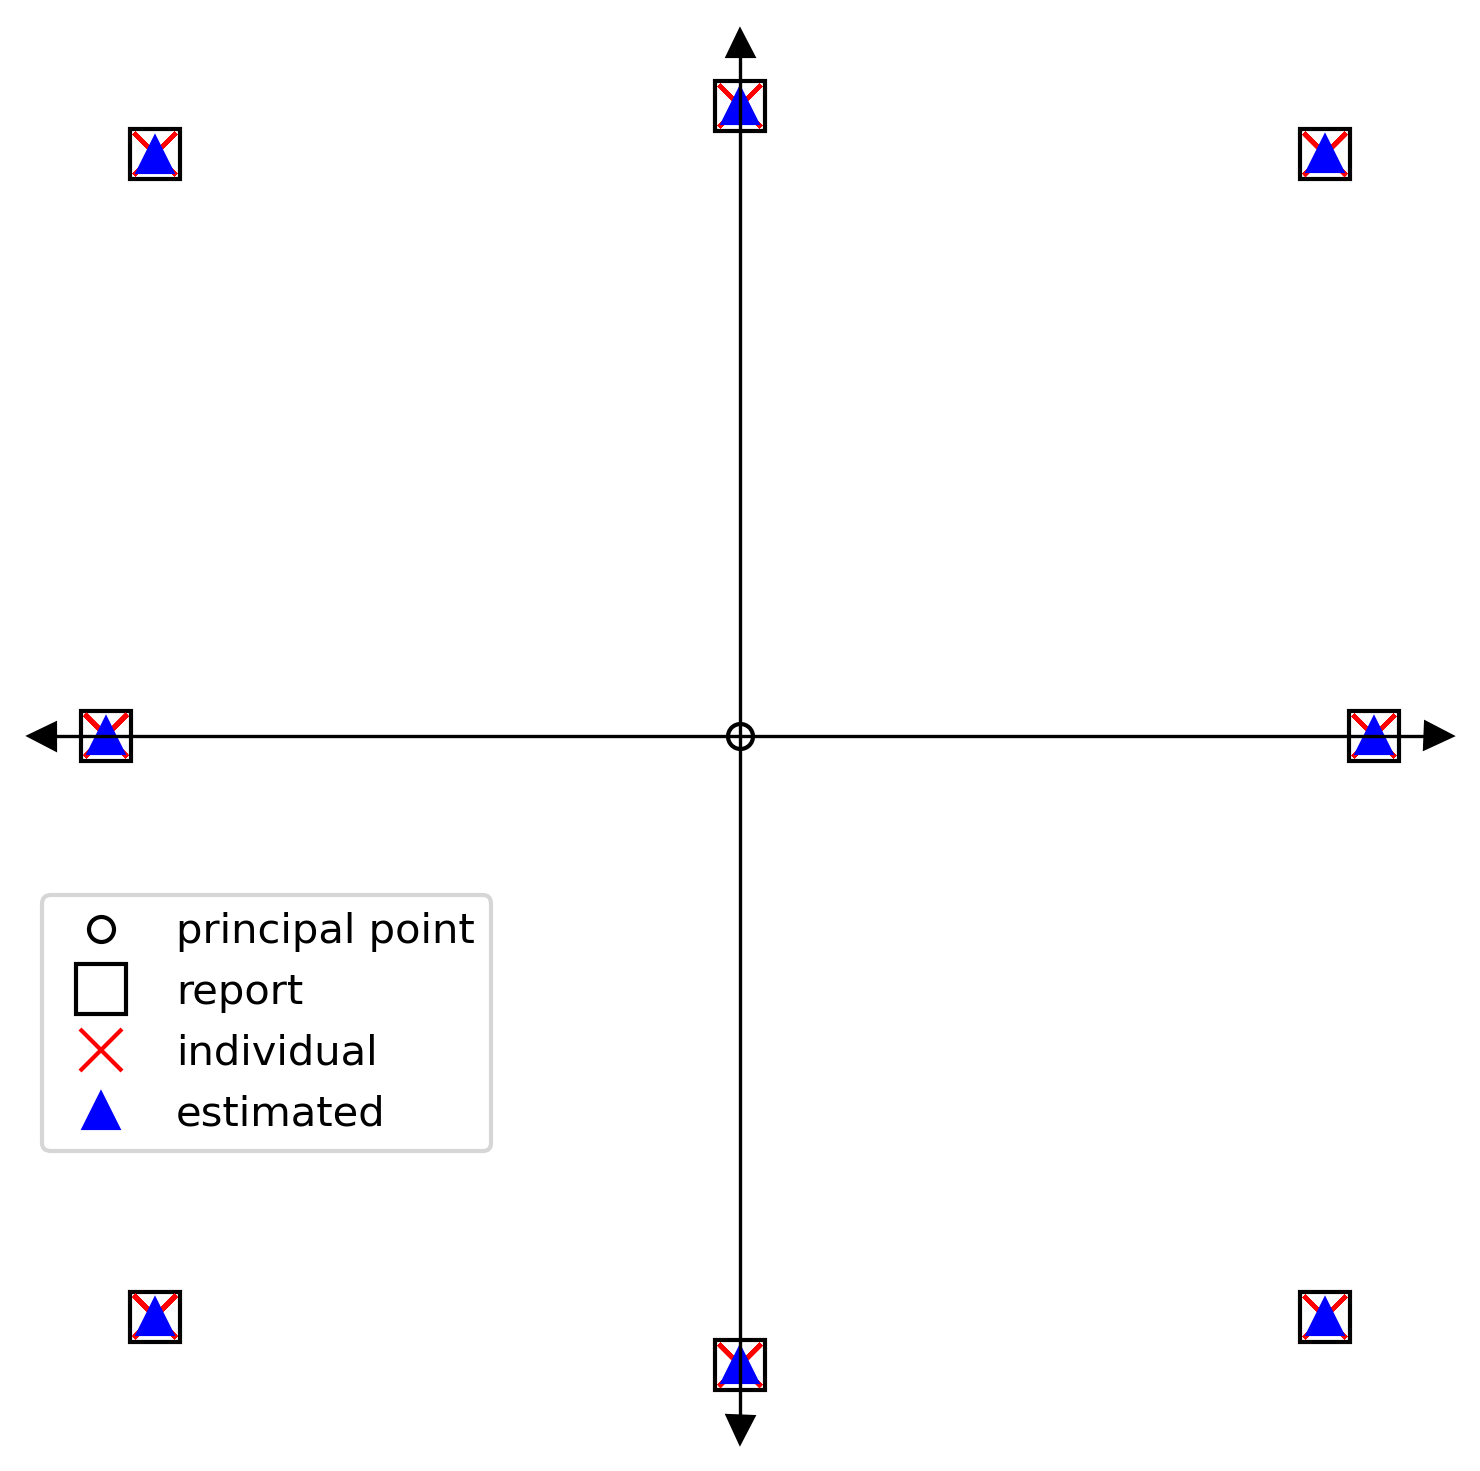
This looks rather good - on our diagram, the locations all align reasonably well. If we take the difference
between the values from the report, and the values estimated by
estimate_measures_camera, we can see that the locations agree
to better than 0.04 mm:
name |
\(\Delta x\) |
\(\Delta y\) |
|---|---|---|
P1 |
0.0191 |
-0.0312 |
P2 |
0.0247 |
-0.0198 |
P3 |
-0.0086 |
-0.0200 |
P4 |
-0.0117 |
-0.0152 |
P5 |
-0.0192 |
0.0064 |
P6 |
0.0163 |
0.0046 |
P7 |
0.0025 |
0.0041 |
P8 |
-0.0064 |
0.0305 |
While this doesn’t replace the value of having a contemporary calibration report for a particular camera, this hopefully provides a reasonable approximation to the correct camera geometry - especially for cases where the original fiducial markers are either ambiguous or cut out of the scan.